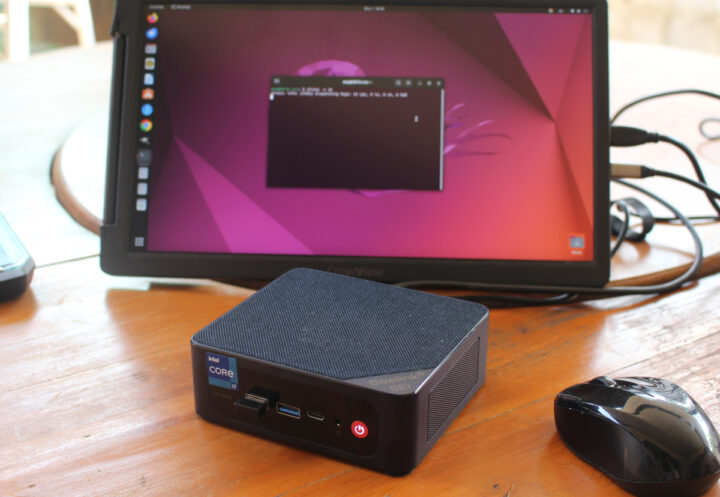
Beelink SEi12 i7-12650H mini PC review – Part 3: Ubuntu 22.04 Linux

After going through an unboxing and teardown of the Beelink SEi12 i7-12650H mini PC, and testing the 12th gen Intel Core i7-12650H mini PC in Windows 11 Pro, we’ll now report our experience with Ubuntu 22.04 in the third part of the review to show how the Beelink SEi12 performs in Linux.
We will perform feature testing, run some benchmarks to evaluate performance, test Ethernet, WiFi 6, and Bluetooth, submit the system to a stress test to check its cooling performance and measure fan noise and power consumption. We’ll also compare it to the GEEKOM Mini IT12 mini PC with the same Intel Core i7-12650H CPU.
Ubuntu 22.04 installation
We shrank the Windows partition is about half to install Ubuntu 22.04 in dual boot configuration along with Windows 11 Pro.
![]()
We then installed Ubuntu 22.04.3 ISO from a USB flash without any issues.
Ubuntu 22.04 system information
After a system update, going to Settings->About shows we have Ubuntu 22.04.4 running on an AZW SEi computer equipped with a 12th Gen Intel Core i7-12650H processor with 16 threads, 32GB RAM, and 626.8 GB of storage (the preinstalled 500GB M.2 SSD plus our own 128GB SATA drive).
![]()
We can find more details in a terminal:
aey@SEi12-cnx:~$ cat /etc/lsb-release
DISTRIB_ID=Ubuntu
DISTRIB_RELEASE=22.04
DISTRIB_CODENAME=jammy
DISTRIB_DESCRIPTION="Ubuntu 22.04.4 LTS"
aey@SEi12-cnx:~$ uname -a
Linux SEi12-cnx 6.5.0-21-generic #21~22.04.1-Ubuntu SMP PREEMPT_DYNAMIC Fri Feb  9 13:32:52 UTC 2 x86_64 x86_64 x86_64 GNU/Linux
aey@SEi12-cnx:~$ free -mh
               total        used        free      shared  buff/cache   available
Mem:            31Gi       1.6Gi        27Gi       539Mi       2.2Gi        28Gi
Swap:          2.0Gi          0B       2.0Gi
aey@SEi12-cnx:~$ df -mh
Filesystem      Size  Used Avail Use% Mounted on
tmpfs           3.2G  2.4M  3.2G   1% /run
/dev/nvme0n1p5  227G   15G  202G   7% /
tmpfs            16G   46M   16G   1% /dev/shm
tmpfs           5.0M  4.0K  5.0M   1% /run/lock
efivarfs        192K  110K   78K  59% /sys/firmware/efi/efivars
/dev/nvme0n1p1   96M   33M   64M  34% /boot/efi
tmpfs           3.2G  128K  3.2G   1% /run/user/1000
The inxi command provides more details:
aey@SEi12-cnx:~$ inxi -Fc0
System:
  Host: SEi12-cnx Kernel: 6.5.0-21-generic x86_64 bits: 64
    Desktop: GNOME 42.9 Distro: Ubuntu 22.04.4 LTS (Jammy Jellyfish)
Machine:
  Type: Desktop Mobo: AZW model: SEi serial: <superuser required>
    UEFI: American Megatrends LLC. v: ALDER112 date: 06/09/2023
CPU:
  Info: 10-core (6-mt/4-st) model: 12th Gen Intel Core i7-12650H bits: 64
    type: MST AMCP cache: L2: 9.5 MiB
  Speed (MHz): avg: 445 min/max: 400/4600:4700:3500 cores: 1: 400 2: 400
    3: 657 4: 400 5: 534 6: 400 7: 400 8: 400 9: 400 10: 521 11: 400 12: 609
    13: 400 14: 400 15: 400 16: 400
Graphics:
  Device-1: Intel Alder Lake-P GT1 [UHD Graphics] driver: i915 v: kernel
  Display: wayland server: X.Org v: 1.22.1.1 with: Xwayland v: 22.1.1
    compositor: gnome-shell driver: gpu: i915 resolution: 1600x900~60Hz
  OpenGL: renderer: Mesa Intel Graphics (ADL GT2)
    v: 4.6 Mesa 23.2.1-1ubuntu3.1~22.04.2
Audio:
  Device-1: Intel Alder Lake PCH-P High Definition Audio
    driver: snd_hda_intel
  Sound Server-1: ALSA v: k6.5.0-21-generic running: yes
  Sound Server-2: PulseAudio v: 15.99.1 running: yes
  Sound Server-3: PipeWire v: 0.3.48 running: yes
Network:
  Device-1: Realtek RTL8111/8168/8411 PCI Express Gigabit Ethernet
    driver: r8169
  IF: enp3s0 state: down mac: 7c:83:34:bf:01:c2
  Device-2: Intel Wi-Fi 6 AX200 driver: iwlwifi
  IF: wlp4s0 state: up mac: 70:d8:c2:14:a4:4c
Bluetooth:
  Device-1: Intel AX200 Bluetooth type: USB driver: btusb
  Report: hciconfig ID: hci0 state: up address: 70:D8:C2:14:A4:50 bt-v: 3.0
Drives:
  Local Storage: total: 583.76 GiB used: 13.39 GiB (2.3%)
  ID-1: /dev/nvme0n1 vendor: Crucial model: CT500P3PSSD8 size: 465.76 GiB
  ID-2: /dev/sda model: CJ225128TC size: 118 GiB
Partition:
  ID-1: / size: 226.75 GiB used: 13.36 GiB (5.9%) fs: ext4
    dev: /dev/nvme0n1p5
  ID-2: /boot/efi size: 96 MiB used: 32.6 MiB (33.9%) fs: vfat
    dev: /dev/nvme0n1p1
Swap:
  ID-1: swap-1 type: file size: 2 GiB used: 0 KiB (0.0%) file: /swapfile
Sensors:
  System Temperatures: cpu: 43.0 C mobo: N/A
  Fan Speeds (RPM): N/A
Info:
  Processes: 360 Uptime: 20m Memory: 31.11 GiB used: 2.94 GiB (9.5%)
  Shell: Bash inxi: 3.3.13
We have an Intel Core i7-12650H processor with 10-core (6-mt/4-st) and 16 threads closed up to 4700 MHz, a Crucial CT500P3PSSD8 with size 465.76 GB capacity, a CJ225128TC SATA SSD that we installed for testing, and an AX200 module for WiFi and Bluetooth. The CPU temperature is reported to be 43°C at idle which seems about right, but we’ll test that again.
Ubuntu 22.04 benchmarks on Beelink SEi12 i7-12650H mini PC
Let’s start with sbc-bench.sh:
aey@SEi12-cnx:~/Downloads/sbc-bench-master$ sudo ./sbc-bench.sh -r
Starting to examine hardware/software for review purposes...

sbc-bench v0.9.64

Installing needed tools: apt-get -f -qq -y install gcc make build-essential powercap-utils curl git sysstat links mmc-utils smartmontools stress-ng p7zip, tinymembench, ramlat, mhz, cpufetch, cpuminer. Done.
Checking cpufreq OPP. Done.
Executing tinymembench. Done.
Executing RAM latency tester. Done.
Executing OpenSSL benchmark. Done.
Executing 7-zip benchmark. Done.
Throttling test: heating up the device, 5 more minutes to wait. Done.
Checking cpufreq OPP again. Done (14 minutes elapsed).

Results validation:

  * Measured clockspeed not lower than advertised max CPU clockspeed
  * No swapping
  * Background activity (%system) OK
  * Powercap detected. Details: "sudo powercap-info -p intel-rapl" -> https://tinyurl.com/4jh9nevj


Full results uploaded to http://sprunge.us/KNs4cT


# AZW SEi  / i7-12650H

Tested with sbc-bench v0.9.64 on Wed, 28 Feb 2024 15:41:49 +0700. Full info: [http://sprunge.us/KNs4cT](http://sprunge.us/KNs4cT)

### General information:

    Information courtesy of cpufetch:

    Name:                12th Gen Intel(R) Core(TM) i7-12650H
    Microarchitecture:   Alder Lake
    Technology:          10nm
    P-cores:
      Max Frequency:     4.700 GHz
      Cores:             6 cores (12 threads)
      AVX:               AVX,AVX2
      FMA:               FMA3
      L1i Size:          32KB (192KB Total)
      L1d Size:          48KB (288KB Total)
      L2 Size:           1.25MB (7.5MB Total)
    E-cores:
      Max Frequency:     3.500 GHz
      Cores:             4 cores
      AVX:               AVX,AVX2
      FMA:               FMA3
      L1i Size:          64KB (256KB Total)
      L1d Size:          32KB (128KB Total)
      L2 Size:           2MB
    L3 Size:             24MB
    Peak Performance:    1.35 TFLOP/s

The CPU features 2 clusters of different core types:

    i7-12650H, Kernel: x86_64, Userland: amd64

    CPU sysfs topology (clusters, cpufreq members, clockspeeds)
                     cpufreq   min    max
     CPU    cluster  policy   speed  speed   core type
      0        0        0      400    4600   Golden Cove
      1        0        1      400    4600   Golden Cove
      2        0        2      400    4600   Golden Cove
      3        0        3      400    4600   Golden Cove
      4        0        4      400    4700   Golden Cove
      5        0        5      400    4700   Golden Cove
      6        0        6      400    4700   Golden Cove
      7        0        7      400    4700   Golden Cove
      8        0        8      400    4600   Golden Cove
      9        0        9      400    4600   Golden Cove
     10        0       10      400    4600   Golden Cove
     11        0       11      400    4600   Golden Cove
     12        0       12      400    3500   Gracemont
     13        0       13      400    3500   Gracemont
     14        0       14      400    3500   Gracemont
     15        0       15      400    3500   Gracemont

31855 KB available RAM

### Clockspeeds (idle vs. heated up):

Before at 51.0°C:

    cpu0-cpu11 (Golden Cove): OPP: 4600, Measured: 4585
    cpu12-cpu15 (Gracemont): OPP: 3500, Measured: 3488

After at 84.0°C:

    cpu0-cpu11 (Golden Cove): OPP: 4600, Measured: 4587
    cpu12-cpu15 (Gracemont): OPP: 3500, Measured: 3490

### Performance baseline

  * cpu0 (Golden Cove): memcpy: 22040.2 MB/s, memchr: 34825.5 MB/s, memset: 27417.4 MB/s
  * cpu12 (Gracemont): memcpy: 8546.0 MB/s, memchr: 19112.5 MB/s, memset: 14312.9 MB/s
  * cpu0 (Golden Cove) 16M latency: 29.04 19.67 21.91 19.10 20.29 19.43 19.30 20.31
  * cpu12 (Gracemont) 16M latency: 41.20 32.55 37.93 33.07 34.33 30.04 30.17 36.84
  * cpu0 (Golden Cove) 128M latency: 104.9 104.3 105.0 100.9 102.9 103.7 90.12 95.98
  * cpu12 (Gracemont) 128M latency: 126.8 121.7 126.9 123.3 128.1 123.0 122.3 122.5
  * 7-zip MIPS (3 consecutive runs): 45080, 41688, 41058 (42610 avg), single-threaded: 5420
  * `aes-256-cbc    1275788.40k  1575155.20k  1603204.35k  1607265.62k  1606284.63k  1587265.54k (Golden Cove)`
  * `aes-256-cbc     973922.28k  1213948.46k  1254906.45k  1265038.68k  1255445.85k  1265090.56k (Gracemont)`

### PCIe and storage devices:

  * Realtek RTL8111/8168/8211/8411 PCI Express Gigabit Ethernet: Speed 2.5GT/s (ok), Width x1 (ok), driver in use: r8169
  * Intel Wi-Fi 6 AX200: Speed 5GT/s (ok), Width x1 (ok), driver in use: iwlwifi
  * 465.8GB "Crucial CT500P3PSSD8" SSD as /dev/nvme0: Speed 16GT/s (ok), Width x4 (ok), 0% worn out, 213 error log entries, unhealthy drive temp: 68°C
  * 118GB "CJ225128TC" SSD as /dev/sda: SATA 2.6, 3.0 Gb/s (current: 3.0 Gb/s), drive temp: 40°C
  * Winbond W25Q128 16MB SPI NOR flash, drivers in use: spi-nor/intel-spi

"nvme error-log /dev/nvme0 ; smartctl -x /dev/nvme0" could be used to get further information about the reported issues.

### Challenging filesystems:

The following partitions are NTFS: nvme0n1p3,nvme0n1p4 -> https://tinyurl.com/mv7wvzct

### Swap configuration:

  * /swapfile on /dev/nvme0n1p5: 2.0G (0K used)

### Software versions:

  * Ubuntu 22.04.4 LTS (jammy)
  * Compiler: /usr/bin/gcc (Ubuntu 11.4.0-1ubuntu1~22.04) 11.4.0 / x86_64-linux-gnu
  * OpenSSL 3.0.2, built on 15 Mar 2022 (Library: OpenSSL 3.0.2 15 Mar 2022)

### Kernel info:

  * `/proc/cmdline: BOOT_IMAGE=/boot/vmlinuz-6.5.0-21-generic root=UUID=18e952a3-4ef5-4c4d-8004-84f53b2e1f0d ro quiet splash vt.handoff=7`
  * Vulnerability Spec store bypass:    Mitigation; Speculative Store Bypass disabled via prctl
  * Vulnerability Spectre v1:           Mitigation; usercopy/swapgs barriers and __user pointer sanitization
  * Vulnerability Spectre v2:           Mitigation; Enhanced / Automatic IBRS, IBPB conditional, RSB filling, PBRSB-eIBRS SW sequence
  * Kernel 6.5.0-21-generic / CONFIG_HZ=250

Waiting for the device to cool down................................... 53.0°C^C
No thermal CPU throttling was detected, and the 7-zip benchmark score was 42,610 MIPS on average, with the first run as high as 45,080 MIPS (due to the initial burst in performance) and it then stabilizes at 41,688 and 41,058 MIPS in the second and third runs. That’s much higher than the score in the GEEKOM Mini IT12 (35,730 MIPS) and we initially thought this could be due to the default PL1 and PL2 power limits:
aey@SEi12-cnx:~$ sudo powercap-info -p intel-rapl
enabled: 1
Zone 0
  name: package-0
  enabled: 1
  max_energy_range_uj: 262143328850
  energy_uj: 28853949632
  Constraint 0
    name: long_term
    power_limit_uw: 35000000
    time_window_us: 55967744
    max_power_uw: 45000000
  Constraint 1
    name: short_term
    power_limit_uw: 55000000
    time_window_us: 2440
    max_power_uw: 0
  Constraint 2
    name: peak_power
    power_limit_uw: 80000000
    max_power_uw: 0
  Zone 0:0
    name: core
    enabled: 0
    max_energy_range_uj: 262143328850
    energy_uj: 14946156195
    Constraint 0
      name: long_term
      power_limit_uw: 0
      time_window_us: 976
  Zone 0:1
    name: uncore
    enabled: 0
    max_energy_range_uj: 262143328850
    energy_uj: 57907322
    Constraint 0
      name: long_term
      power_limit_uw: 0
      time_window_us: 976
PL1 is set to 35W, and PL2 to 55W in the Beelink mini PC, while the Mini IT12 had those set to 35W and 80W respectively. So the power limits should not be involved here, and I’m guessing the thermal design is better in the Beelink mini PC so multi-core performance is better than in the GEEKOM Mini IT12, as we had already reported in the Windows 11 Pro review.
sbc-bench.sh also reports errors for the NVMe SSD drive as well as a high drive temperature:
aey@SEi12-cnx:~$ sudo nvme error-log /dev/nvme0
Error Log Entries for device:nvme0 entries:16
.................
 Entry[ 0]
.................
error_count	: 215
sqid		: 0
cmdid		: 0x8
status_field	: 0x2002(INVALID_FIELD: A reserved coded value or an unsupported value in a defined field)
phase_tag	: 0x1
parm_err_loc	: 0x28
lba		: 0
nsid		: 0
vs		: 0
trtype		: The transport type is not indicated or the error is not transport related.
cs		: 0
trtype_spec_info: 0
.................
aey@SEi12-cnx:~$ sudo smartctl -x /dev/nvme0
smartctl 7.2 2020-12-30 r5155 [x86_64-linux-6.5.0-21-generic] (local build)
Copyright (C) 2002-20, Bruce Allen, Christian Franke, www.smartmontools.org

=== START OF INFORMATION SECTION ===
Model Number:                       CT500P3PSSD8
Serial Number:                      2330E8647A1B
Firmware Version:                   P9CR40A
PCI Vendor/Subsystem ID:            0xc0a9
IEEE OUI Identifier:                0x00a075
Controller ID:                      1
NVMe Version:                       1.4
Number of Namespaces:               1
Namespace 1 Size/Capacity:          500,107,862,016 [500 GB]
Namespace 1 Formatted LBA Size:     512
Namespace 1 IEEE EUI-64:            6479a7 7f3000005a
Local Time is:                      Sat Mar  2 16:12:08 2024 +07
Firmware Updates (0x12):            1 Slot, no Reset required
Optional Admin Commands (0x0017):   Security Format Frmw_DL Self_Test
Optional NVM Commands (0x005e):     Wr_Unc DS_Mngmt Wr_Zero Sav/Sel_Feat Timestmp
Log Page Attributes (0x06):         Cmd_Eff_Lg Ext_Get_Lg
Maximum Data Transfer Size:         64 Pages
Warning  Comp. Temp. Threshold:     85 Celsius
Critical Comp. Temp. Threshold:     95 Celsius

Supported Power States
St Op     Max   Active     Idle   RL RT WL WT  Ent_Lat  Ex_Lat
 0 +     6.00W  0.0000W       -    0  0  0  0        0       0
 1 +     3.00W  0.0000W       -    0  0  0  0        0       0
 2 +     1.50W  0.0000W       -    0  0  0  0        0       0
 3 -   0.0250W  0.0000W       -    3  3  3  3     5000    1900
 4 -   0.0030W       -        -    4  4  4  4    13000  100000

Supported LBA Sizes (NSID 0x1)
Id Fmt  Data  Metadt  Rel_Perf
 0 +     512       0         1
 1 -    4096       0         0

=== START OF SMART DATA SECTION ===
SMART overall-health self-assessment test result: PASSED

SMART/Health Information (NVMe Log 0x02)
Critical Warning:                   0x00
Temperature:                        48 Celsius
Available Spare:                    100%
Available Spare Threshold:          5%
Percentage Used:                    0%
Data Units Read:                    4,937,505 [2.52 TB]
Data Units Written:                 2,694,686 [1.37 TB]
Host Read Commands:                 46,223,348
Host Write Commands:                38,475,534
Controller Busy Time:               87
Power Cycles:                       27
Power On Hours:                     164
Unsafe Shutdowns:                   2
Media and Data Integrity Errors:    0
Error Information Log Entries:      215
Warning  Comp. Temperature Time:    0
Critical Comp. Temperature Time:    0
Temperature Sensor 1:               48 Celsius
Temperature Sensor 2:               55 Celsius
Temperature Sensor 8:               48 Celsius

Error Information (NVMe Log 0x01, 16 of 16 entries)
Num   ErrCount  SQId   CmdId  Status  PELoc          LBA  NSID    VS
  0        215     0  0x0008  0x4005  0x028            0     0
I’m not 100% sure what the error is, but it looks like the controller may just not support some commands, and it’s not a big issue.
We then tested the CPU single-core and multi-core performance with Geekbench 6.2.2.
That would be 2,589 points for the single-core benchmark and 10,208 points for the multi-core one. The single-core result is similar to the one in the GEEKOM Mini IT12 (2,575 points), but the multi-core result is better in the Beelink SEi12 i7-12650H mini PC (Mini IT12: 9,874 points) although not with a difference as great as in the 7-zip benchmark.
We’ll evaluate 3D graphics performance with Unigine Heaven Benchmark 4.0.
The Beelink SEi12 i7-12650H mini PC achieved 38.5 FPS on average and got a score of 969 points at 1920×1080 resolution.
Next up is YouTube video streaming at 4K and 8K resolution in the Chrome web browser.
![]()
8K 30 FPS played great with no frame dropped after watching the video for 9 minutes.
![]()
Same thing for 8K 30 FPS (4320p).
![]()
As usual, 60 FPS becomes more challenging, but the Beelink SEi12 mini PC handles that relatively well at 4K 60 FPS with only 92 frames dropped out of 54,226 after playing the video for 15 minutes.
![]()
Sadly, 8K 60 FPS is another story, and the video is unwatchable with 2045 frames dropped out of 5825 in a short test, and we can also see the loading wheel from time to time although the buffer has enough data for 20 seconds of playback.
![]()
We tried to play the video in Firefox just in case, but the result is even worse with 2,285 frames dropped out of 2,689. This issue did not occur in the Beelink SEi12 i7-12650H Windows 11 Pro review, and more surprisingly, the GEEKOM Mini IT12 could play 8K 60 FPS YouTube videos with AV1 codec just fine in Firefox… Not sure what happened here.
Speedometer 2.0 was used to estimate the web browsing performance in the latest version of Firefox.
![]()
The system averages 291 runs per minute with the results varying between 277.7 and 295.4 runs per minute.
Beelink SEi12 i7-12650H Ubuntu benchmarks against other mini PCs
Now that we have Ubuntu 22.04 benchmark results for the Beelink SEi12 i7-12650H, let’s compare its performance against the GEEKOM Mini IT12 (with the same Intel Core i7-12650H), GEEKOM Mini IT13 (Intel Core i9-13900H), GEEKOM AS 6 (AMD Ryzen 9 6900HX), and Khadas Mind Premium (Intel Core i7-1360P).
Before looking a the results, we should probably check out the main specifications of the five mini PCs.
| Beelink SEi12 | GEEKOM Mini IT12 | GEEKOM Mini IT13 | GEEKOM AS 6 | Khadas Mind Premium | |
|---|---|---|---|---|---|
| SoC | Intel Core i7-12650H | Intel Core i7-12650H | Intel Core i9-13900H | AMD Ryzen 9 6900HX | Intel Core i7-1360P |
| CPU | 10-cores/16-thread processor up to 4.70 GHz | 10-cores/16-thread processor up to 4.70 GHz | 14-core/20-core processor up to 5.4 GHz, | 8-core/16-thread processor up to 4.9 GHz | 12-core/16-core processor up to 5.0 GHz |
| GPU | 64 EU Intel UHD Graphics (Alder Lake-P GT2) | 64 EU Intel UHD Graphics (Alder Lake-P GT2) | 96 EU Intel Iris Xe Graphics | AMD Radeon Graphics 680M | 96 EU Intel Iris Xe |
| Memory | 32GB DDR4-3200 | 32GB DDR4-3200 | 32GB DDR4-3200 | 32GB DDR5-4800 | 32GB LPDDR5-5200 |
| Storage | 500 GB NVMe SSD | 1TB NVMe SSD | 2TB NVMe SSD | 1TB NVMe SSD | 51TB NVMe SSD |
| Default OS | Windows 11 Pro | Windows 11 Pro | Windows 11 Pro | Windows 11 Pro | Windows 11 Home |
Ubuntu 22.04 benchmark results comparison.
| Beelink SEi12 | GEEKOM Mini IT12 | GEEKOM Mini IT13 | GEEKOM AS 6 | Khadas Mind Premium | |
|---|---|---|---|---|---|
| sbc-bench.sh | |||||
| - memcpy | 22,040.2 MB/s (P-Core) | 24,180.5 MB/s (P-Core) | 24,014.4 MB/s (P-core) | 19,131.7 MB/s | 25,389.5 MB/s (P-core) |
| - memset | 27,417.4 MB/s (P-Core) | 27,539.6 MB/s P-Core) | 26,647.9 MB/s (P-Core) | 16,781.4 MB/s | 24,731.8MB/s (P-core) |
| - 7-zip (average) | 42,610 | 35,730 | 56,540 | 54,592 | 44,430 |
| - 7-zip (top result) | 45,080 | 41,360 | 60,981 | 56,251 | 50,396 |
| - OpenSSL AES-256 16K | 1,587,265.54k (P-Core) | 1,630,005.93k (P-Core) | 1,844,401.49k (P-Core) | 1,249,203.54k | 1,771,334.31k (P-Core) |
| Geekbench 6 Single | 2,589 | 2,575 | 2,745 | 1,992 | 2,093 |
| Geekbench 6 Multi | 10,208 | 9,874 | 11,974 | 9,535 | 8,891 |
| Unigine Heaven score | 969 | 1,002 | 1,333 | 1,553 | 1,349 |
| Speedometer (Firefox) | 291 | 302 | 273 | 202 | 242 |
Just like the GEEKOM Mini IT12, the Beelink SEi12 i7-12650H mini PC has excellent single-core performance as illustrated in Geekbench 6 (single core) and Speedometer results, while the 64EU Intel iGPU is a weak point of the Core i7-12650H processor. Multi-core performance is however quite better in the Beelink mini PC than in the GEEKOM device as we can see from the 7-zip results, and to a much lesser extent in the GeekBench 6.2 multi-core benchmark.
Storage performance
iozone3 command line utility can help us evaluate the performance of the 500GB NVMe SSD that comes with the mini PC:
aey@SEi12-cnx:~$ sudo iozone -e -I -a -s 1000M -r 4k -r 16k -r 512k -r 1024k -r 16384k -i 0 -i 1 -i 2

                                                              random    random     bkwd    record    stride
              kB  reclen    write  rewrite    read    reread    read     write     read   rewrite      read   fwrite frewrite    fread  freread
         1024000       4   494627   650667   178133   177569    72708   638548
         1024000      16  1386403  1692866   198590   187623   249485  1649280
         1024000     512  1850221  1847238  2039320  2047148  2032015  1837493
         1024000    1024  1825982  1884587  2737001  2759891  2754761  1845733
         1024000   16384  1820277  1843006  4431412  4468037  4464029  1837319

iozone test complete.
That’s a sequential read speed of about 4,431 MB/s and a sequential write speed of around 1820 MB/s which compares to 4,836 MB/s and 1,905 MB/s in Windows using CrystalDiskMark.
We also tested the SATA interface with an entry-level 128GB 2.5-inch SATA SSD using iozone3:
aey@SEi12-cnx:/media/aey/New Volume$ sudo iozone -e -I -a -s 100M -r 16384k -i 0 -i 1

                                                              random    random     bkwd    record    stride
              kB  reclen    write  rewrite    read    reread    read     write     read   rewrite      read   fwrite frewrite    fread  freread
          102400   16384   144165   128322   252595   255083

iozone test complete.
That’s about 252 MB/s for reads and 144Mb/s for writes, or about the same as in Windows, and expected for this specific SATA SSD.
USB ports testing
The speed of the USB ports was tested with an ORICO M234C3-U4 M.2 NVMe SSD enclosure together with lsusb and iozone3 command line utilities. A Seagate USB HDD will be used for the USB 2.0 ports since the ORICO enclosure is not backward compatible.
For reference, here’s the output for the front left USB port (10 Gbps)…
aey@SEi12-cnx:~$ lsusb -t | grep uas
    |__ Port 2: Dev 2, If 0, Class=Mass Storage, Driver=uas, 10000M

aey@SEi12-cnx:/media/aey/EXT4-REVIEW$ sudo iozone -e -I -a -s 1000M -r 16384k -i 0 -i 1

                                                              random    random     bkwd    record    stride
              kB  reclen    write  rewrite    read    reread    read     write     read   rewrite      read   fwrite frewrite    fread  freread
         1024000   16384   991006   992899   870106   872809

iozone test complete.
… and the results for the top USB 2.0 port on the rear panel:
aey@SEi12-cnx:~$ lsusb -t | grep uas
    |__ Port 5: Dev 10, If 0, Class=Mass Storage, Driver=uas, 480M
aey@SEi12-cnx:/media/aey/USB3_EXT4$ sudo iozone -e -I -a -s 100M -r 16384k -i 0 -i 1

                                                              random    random     bkwd    record    stride
              kB  reclen    write  rewrite    read    reread    read     write     read   rewrite      read   fwrite frewrite    fread  freread
          102400   16384    40168    42192    39006    41072

iozone test complete.
Summary of the results for the five ports:
- Front panel (left to right)
- USB-A #1 – USB 3.2 – USB 3.1 SuperSpeedPlus (10 Gbps) – Read: 870 MB/s; write: 991 MB/s
- USB-A #2 – USB 3.2 – USB 3.1 SuperSpeedPlus (10 Gbps) – Read: 854 MB/s; write: 958 MB/s
- USB-C #1 – USB 3.2 – USB 3.1 SuperSpeedPlus (10 Gbps) – Read: 853 MB/s; write: 944 MB/s
- Rear panel
- USB-A #1 (top) – USB 2.0 – USB 2.0 Hight-Speed (480 Mbps) – Read: 39 MB/s; write: 40 MB/s
- USB-A #2 (bottom) – USB 2.0 – USB 2.0 Hight-Speed (480 Mbps) – Read: 40 MB/s; write: 31 MB/s
Everything works as expected here.
Networking performance (Gigabit Ethernet and WiFi 6)
The Gigabit Ethernet port was tested with iperf3 using AAEON UP Xtreme 11 mini PC (192.168.31.12) on the other side.
- Download
aey@SEi12-cnx:~$ iperf3 -t 60 -c 192.168.31.12 -i 10 -R
Connecting to host 192.168.31.12, port 5201
Reverse mode, remote host 192.168.31.12 is sending
[  5] local 192.168.31.74 port 58720 connected to 192.168.31.12 port 5201
[ ID] Interval           Transfer     Bitrate
[  5]   0.00-10.00  sec  1.10 GBytes   942 Mbits/sec
[  5]  10.00-20.00  sec  1.10 GBytes   942 Mbits/sec
[  5]  20.00-30.00  sec  1.10 GBytes   942 Mbits/sec
[  5]  30.00-40.00  sec  1.10 GBytes   942 Mbits/sec
[  5]  40.00-50.00  sec  1.10 GBytes   942 Mbits/sec
[  5]  50.00-60.00  sec  1.10 GBytes   942 Mbits/sec
- - - - - - - - - - - - - - - - - - - - - - - - -
[ ID] Interval           Transfer     Bitrate         Retr
[  5]   0.00-60.04  sec  6.58 GBytes   941 Mbits/sec    0             sender
[  5]   0.00-60.00  sec  6.58 GBytes   942 Mbits/sec                  receiver

iperf Done.
- Upload
aey@SEi12-cnx:~$ iperf3 -t 60 -c 192.168.31.12 -i 10
Connecting to host 192.168.31.12, port 5201
[  5] local 192.168.31.74 port 56696 connected to 192.168.31.12 port 5201
[ ID] Interval           Transfer     Bitrate         Retr  Cwnd
[  5]   0.00-10.00  sec  1.10 GBytes   943 Mbits/sec    0    363 KBytes
[  5]  10.00-20.00  sec  1.10 GBytes   942 Mbits/sec    0    795 KBytes
[  5]  20.00-30.00  sec  1.10 GBytes   942 Mbits/sec    0    795 KBytes
[  5]  30.00-40.00  sec  1.10 GBytes   942 Mbits/sec    0    795 KBytes
[  5]  40.00-50.00  sec  1.10 GBytes   942 Mbits/sec    0    795 KBytes
[  5]  50.00-60.00  sec  1.10 GBytes   942 Mbits/sec    0    795 KBytes
- - - - - - - - - - - - - - - - - - - - - - - - -
[ ID] Interval           Transfer     Bitrate         Retr
[  5]   0.00-60.00  sec  6.58 GBytes   942 Mbits/sec    0             sender
[  5]   0.00-60.05  sec  6.58 GBytes   941 Mbits/sec                  receiver

iperf Done.
- Full duplex
aey@SEi12-cnx:~$ iperf3 -t 60 -c 192.168.31.12 -i 10 -bidir
Connecting to host 192.168.31.12, port 5201
[  5] local 192.168.31.74 port 42466 connected to 192.168.31.12 port 5201
[ ID] Interval           Transfer     Bitrate         Retr  Cwnd
[  5]   0.00-10.00  sec  1.10 GBytes   943 Mbits/sec    0    468 KBytes
[  5]  10.00-20.00  sec  1.10 GBytes   941 Mbits/sec    0    468 KBytes
[  5]  20.00-30.00  sec  1.10 GBytes   941 Mbits/sec    0    468 KBytes
[  5]  30.00-40.00  sec  1.10 GBytes   942 Mbits/sec   36    454 KBytes
[  5]  40.00-50.00  sec  1.10 GBytes   942 Mbits/sec    0    454 KBytes
[  5]  50.00-60.00  sec  1.10 GBytes   941 Mbits/sec    0    454 KBytes
- - - - - - - - - - - - - - - - - - - - - - - - -
[ ID] Interval           Transfer     Bitrate         Retr
[  5]   0.00-60.00  sec  6.58 GBytes   942 Mbits/sec   36             sender
[  5]   0.00-60.04  sec  6.58 GBytes   941 Mbits/sec                  receiver

iperf Done.
All good here. It’s better than in Windows, where the data rate dropped to 883 Mbps in one direction (upload).
Time to test WiFi 6 through a Xiaomi Mi AX6000 router.
- Download
aey@SEi12-cnx:~$ iperf3 -t 60 -c 192.168.31.12 -i 10 -R
Connecting to host 192.168.31.12, port 5201
Reverse mode, remote host 192.168.31.12 is sending
[  5] local 192.168.31.127 port 40354 connected to 192.168.31.12 port 5201
[ ID] Interval           Transfer     Bitrate
[  5]   0.00-10.00  sec  1.08 GBytes   927 Mbits/sec
[  5]  10.00-20.00  sec  1.09 GBytes   939 Mbits/sec
[  5]  20.00-30.00  sec  1.10 GBytes   941 Mbits/sec
[  5]  30.00-40.00  sec  1.09 GBytes   933 Mbits/sec
[  5]  40.00-50.00  sec  1.10 GBytes   942 Mbits/sec
[  5]  50.00-60.00  sec  1.10 GBytes   941 Mbits/sec
- - - - - - - - - - - - - - - - - - - - - - - - -
[ ID] Interval           Transfer     Bitrate         Retr
[  5]   0.00-60.04  sec  6.55 GBytes   937 Mbits/sec    0             sender
[  5]   0.00-60.00  sec  6.55 GBytes   937 Mbits/sec                  receiver

iperf Done.
- Upload
aey@SEi12-cnx:~$ iperf3 -t 60 -c 192.168.31.12 -i 10
Connecting to host 192.168.31.12, port 5201
[  5] local 192.168.31.127 port 34882 connected to 192.168.31.12 port 5201
[ ID] Interval           Transfer     Bitrate         Retr  Cwnd
[  5]   0.00-10.00  sec  1.08 GBytes   928 Mbits/sec   65   1.59 MBytes
[  5]  10.00-20.00  sec  1.10 GBytes   942 Mbits/sec    7   1.76 MBytes
[  5]  20.00-30.00  sec  1.10 GBytes   942 Mbits/sec    2   1.70 MBytes
[  5]  30.00-40.00  sec  1.10 GBytes   942 Mbits/sec    8   1.27 MBytes
[  5]  40.00-50.00  sec  1.10 GBytes   942 Mbits/sec    1   1.26 MBytes
[  5]  50.00-60.00  sec  1.10 GBytes   942 Mbits/sec    4   1.44 MBytes
- - - - - - - - - - - - - - - - - - - - - - - - -
[ ID] Interval           Transfer     Bitrate         Retr
[  5]   0.00-60.00  sec  6.56 GBytes   939 Mbits/sec   87             sender
[  5]   0.00-60.05  sec  6.56 GBytes   938 Mbits/sec                  receiver

iperf Done.
The results – 937 Mbps download and 939 Mbps upload – are so similar to the Ethernet results that we had to double-check, and the IP address is indeed different. As usual, WiFi data transfer rates are better in Linux than in Windows 11, where the system achieved 768 Mbps (DL) and 778 Mbps (UL).
We also quickly tested Bluetooth 5.2 by successfully transferring a file from an Android smartphone.
Stress test and CPU temperature
We’ll now run a stress test on all 16 threads of the Intel Core i7-12650H processor while monitoring the package temperature with Psensor and the CPU frequency with the sbc-bench.sh script.

The screenshot above shows the CPU temperature stays around 87-89°C, with the P-cores running at around 2,800 – 2,900 MHz and the E-core at 2,400 – 2,500 MHz while running the same stress test on the GEEKOM Mini IT12 revealed a different temperature chart with the package temperature quickly jumping to 91°C for a few seconds before dropping and stabilizing at around 81°C over the long run as the Core i7-12650H cores were clocked at 2,600 MHz (P-Cores) and 2,400/2,500 MHz (E-Cores). See below.

These different behaviors should explain the 7-zip benchmark results differences between the two mini PCs, and that means the Beelink SEi12 i7-12650H performs better with the CPU operating at higher frequencies and temperatures under sustained heavy workloads. What we (the team at CNX Software) don’t know is how this might impact the expected lifetime of the processor and mini PC.
Fan noise
The mini PC’s fan is relatively quiet at idle and under light loads but becomes noisier under heavy loads without becoming too annoying. We measured the fan noise with a sound level meter placed approximately 5 cm from the top of the case:
- Idle and web surfing – 45 – 47 dBA
- Stress test (on 16 threads) – 50 – 53 dBA
Note that’s quite noisier than the Mini IT12 which we measured at 39.0 – 41.6 dBA at idle. The sound level meter measures 38 dBA in a quiet room.
Beelink SEi12 i7-12650H power consumption in Ubuntu 22.04
We measured power consumption with a wall power meter as follows:
- Power Off – 1.0 – 1.1 Watts
- Idle – 10.7 – 10.9 Watts
- Video playback – 57.0 – 63.5 Watts (YouTube 8K60fps in Firefox)
- CPU stressed test (stress -c 16)
- During the first 30 seconds 73.0 – 86.6 Watts
- After 30 seconds 60.0 – 63.0 Watts
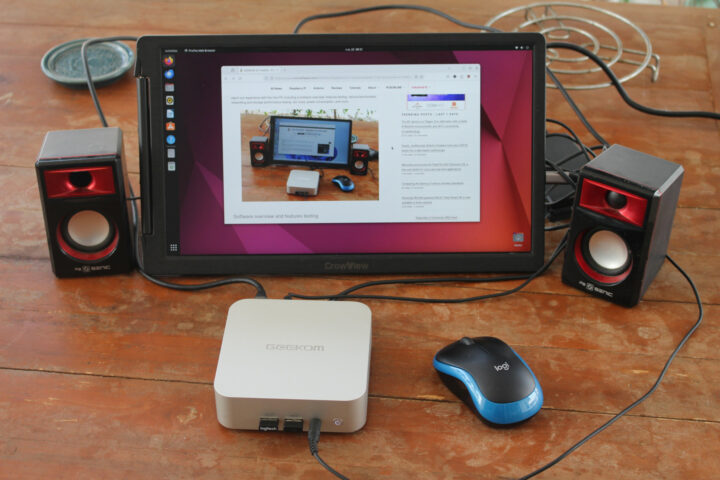
Note: The mini PC was connected over WiFi 6, one 2.4 GHz RF dongle for a wireless keyboard and mouse combo, and a 14-inch CrowView laptop monitor connected via HDMI port and its own power supply.
The stress test power consumption is higher than on the GEEKOM Mini IT12, but that’s normal because the Beelink SEi12 operates at a higher frequency. The big shocker is the power consumption while playing an 8K YouTube video as it’s about three times higher and points to software video decoding which would explain why the 8K 60 FPS video can’t be playing smoothly. Firefox’s compositing is set to “WebRender (Software)” and we tried to change a few settings, but did not manage to enable hardware video decoding.
Conclusion
The Beelink SEi12 i7-12650H mini PC performed well in Ubuntu 22.04 with all features working as expected including video output, gigabit Ethernet, WiFi 6, Bluetooth, and USB ports. YouTube video playback is working fine up to 4Kp60 and 8Kp30, but not 8Kp60 in either Chrome or Firefox.
The SEi12 performs similarly to the GEEKOM Mini IT12, except for multi-core workload where it is quite faster due to different behavior under loads where the Core i7-12650H operates at a higher frequency and temperature in the Beelink mini PC, but the Mini IT12 is configured in such a way to operate at a lower frequency and temperature under sustained multi-core loads. The main downsides compared to the Mini IT12 are the lack of USB4 ports, gigabit Ethernet networking instead of 2.5GbE, and a smaller and slower SSD for the models we tested. The latter also supported 8K 60FPS videos
We’d like to thank Shenzhen AZW Technology (aka Beelink) for sending a review sample of the Beelink SEi12 i7-12650H with 32GB DDR4 and a 500GB M.2 NVMe SSD. This model can be ordered for $439 on Amazon (after ticking on the $110 discount coupon), Aliexpress (some countries only), and on the company’s online store where you can get a $50 discount with the code 1265050 valid until March 31 (but they seem to extend it every month…). For reference, the GEEKOM Mini IT12 (32GB/1TB) typically sells for a little under $520, so the SEi12 model we tested is a cheaper device albeit with a smaller 500GB SSD and fewer ports.
CNXSoft: This review is a translation – with a few additional insights – of the original article on CNX Software Thailand by Suthinee Kerdkaew.
The post Beelink SEi12 i7-12650H mini PC review – Part 3: Ubuntu 22.04 Linux appeared first on CNX Software - Embedded Systems News.

